
How to use our Outage Map
Keeping you informed
Our Outage Map provides power outage and restoration information to customers. To view the map, visit our website and select your location, or download the free Entergy mobile app to find power outages in your area. Use the information below to navigate the map before a major storm affects your community.
During major storms, a lot of activity is happening in the field to restore power as safely and quickly as possible. In these cases, we shift the map into storm mode to provide the latest restoration information as soon as it is available. Read more about storm mode below.
Navigating the Outage Map
Icons at the bottom of the menu on the left can be used for quick navigation. You can switch between views and search for locations by county or parish. To close the menu for an expanded view, select the return arrow at the top right of the menu.
Find your address
Finding your address is easier than ever. The field to enter your address is located prominently on the map for ease of use.

Default view 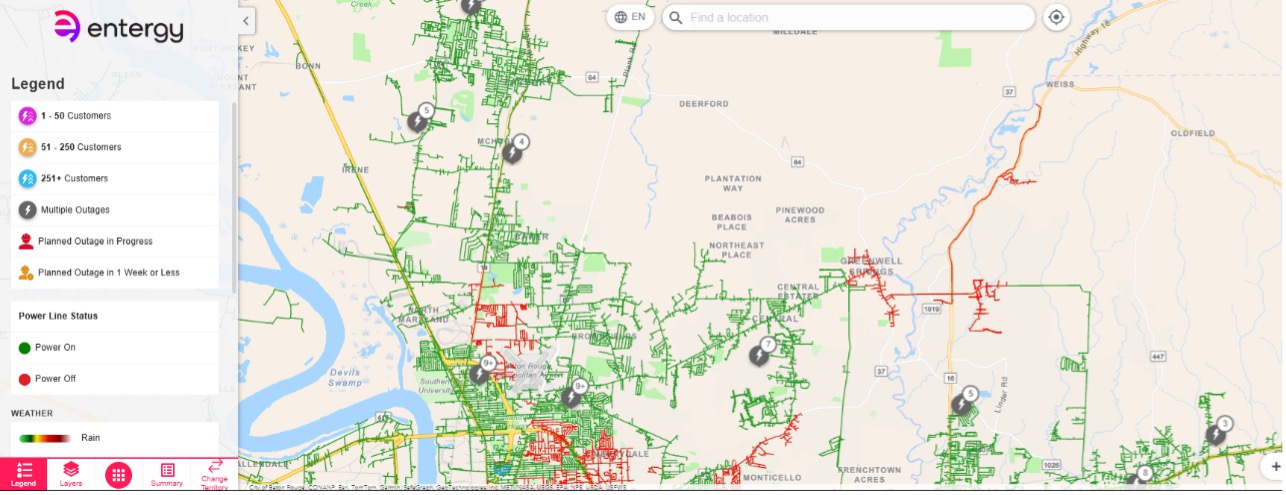
The default map view shows icons and red and green lines indicating power outages on Entergy’s system. The opacity slider — located in the Layers tab of the menu — allows you to change the brightness of these lines.
The line marking Entergy’s service area is black for better visibility.
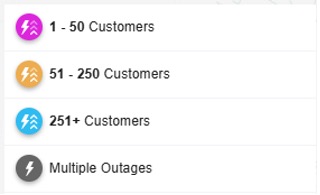
Green lines indicate that the line segment is energized, or power is flowing. Red lines indicate that the line segment is de energized, or no power is flowing. A green line indicates that power has been restored to the area, but it does not necessarily mean power is restored at your specific location. Icons for power outages reflect the number of customers impacted. Select any icon for outage details.
 When outages are present, a number near a circular icon will indicate the number of separate outages in the area. Select the icon for a zoom in option that provides a more detailed map view.
Restoration times are only estimates. An indication that power is restored in your area does not guarantee that your home or business has power. We cannot restore power to structures with damaged electrical equipment.
Layers
The Layers tab provides several overlay options, including planned outages and weather. Turning on the Planned Outage layer shows outages scheduled in advance for emergency repairs or reliability work. The Weather layer displays real time radar to help you monitor conditions in your area.
Two opacity sliders allow you to adjust the brightness of the power line status indicators and the weather overlay.
Additional options include Satellite, Streets Relief Basemap, Topographic Basemap and Territory views.

Summary
The Summary tab shows the total number of outages by county, parish or ZIP code. Selecting a specific area will zoom the map into that location.

Change territory
The Change Territory tab allows you to move between service areas. When you select New Orleans, the black boundary line shows the Entergy New Orleans service area. While viewing New Orleans, the rest of Entergy’s Louisiana service area remains visible. You can also switch to Entergy service areas in Arkansas, Mississippi and Texas.
How to use our Outage Map in storm mode
We are committed to providing customers with the latest outage restoration information. When we experience significant outages or expect major storm impacts, we shift the Outage Map into storm mode. Due to the dynamic nature of restoration response, customers can use the map to look for restoration information and outage notifications. During this time, crews continue safely working to accurately assess damage. Customers are encouraged to report outages using our digital tools, including the free mobile app, online at myEntergy.com or by texting OUT to 36778. You can also call 800-9OUTAGE (800-968-8243), but call volumes are typically high during storm restoration. Entergy provides identical restoration information whether you call customer service or contact us on social media. Updates to your outage status will be available on the Outage Map.
To ensure accuracy, we may disable automated outage notifications. If that occurs, customers should not expect to receive status updates by texting STAT to 36778.
Below are the layers you may see when the map transitions to storm mode.
Location view
During a storm with significant outages, the map icons may not reflect the latest information. Customers may still see red and green lines indicating line status, but these do not necessarily reflect power flow to individual homes, as damage may exist on customer owned equipment. Read the steps for repairing your equipment.
As updates become available, we will provide damage assessment progress and estimated restoration times on the Outage Map. During peak restoration, updates will be shared at least twice a day through the alert banner at the top of the webpage.
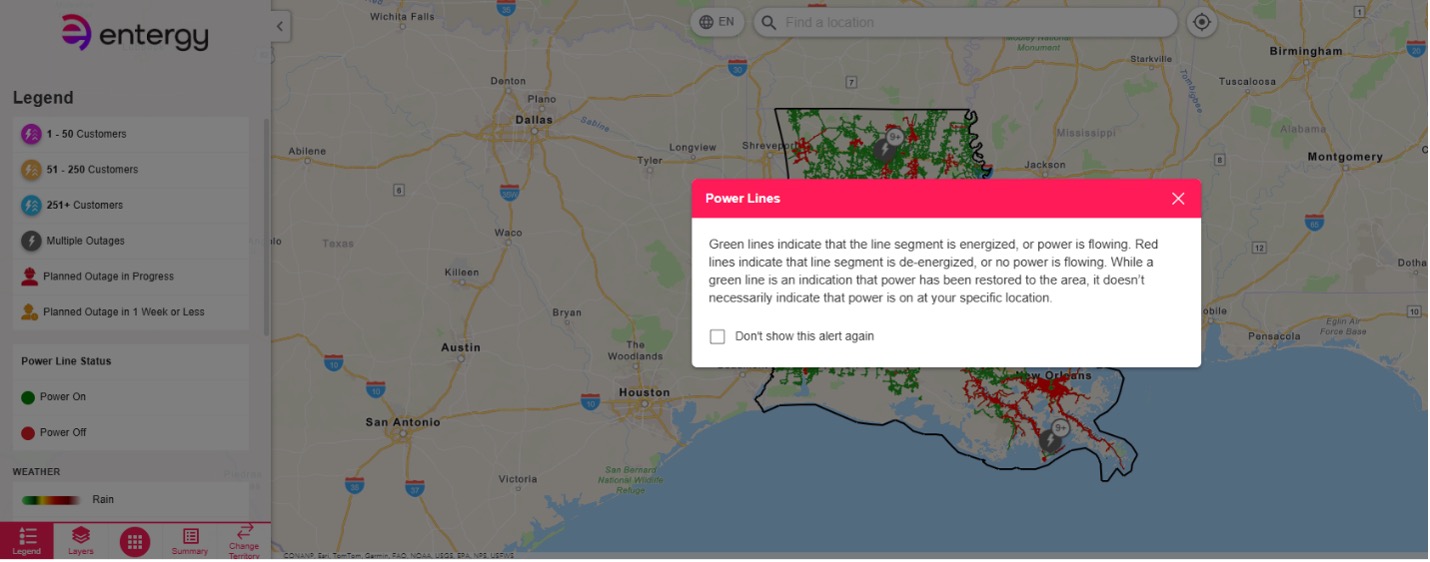
Pre-storm view
When a major storm is approaching, the map may display a pre storm layer showing weather, potential damage and estimated restoration predictions based on historical data. Weather conditions are updated every 30 minutes.
Three color coded bands — green, yellow and red — indicate potential storm impact. Selecting a band or address within a band will open a pop up showing: (1) observed and forecast weather, (2) damage predictions and (3) estimated restoration timelines.
- Green indicates the least severe forecast and light expected infrastructure damage, resulting in the quickest restoration timelines.
- Yellow indicates moderate weather and infrastructure damage, meaning average restoration times.
- Red indicates the most severe weather and significant damage, leading to extended restoration timelines. The number of days required depends on storm category. We will share formal estimates once the storm category is confirmed.
During severe winter weather, pink and blue bands will show potential impacts. Selecting these bands will open the same type of informational pop up.
Damage assessment view
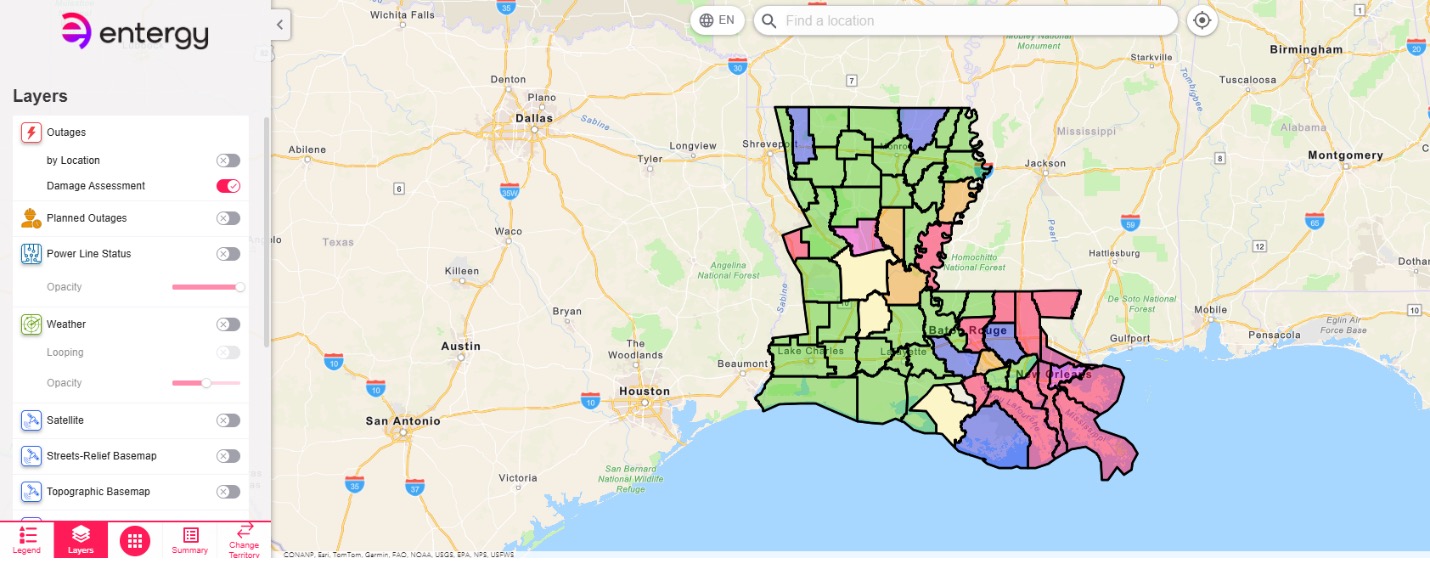
After the storm, the map will display the damage assessment view, showing the number of customers without power by county or parish. As information becomes available, more detailed assessment updates will appear.
For location specific details, customers can enter a ZIP code or service address or hover over their area on the map. A pop up window will display local information.
The damage assessment view typically remains active for about three days. Power is restored in parallel with assessments when possible.
Estimated restoration time view
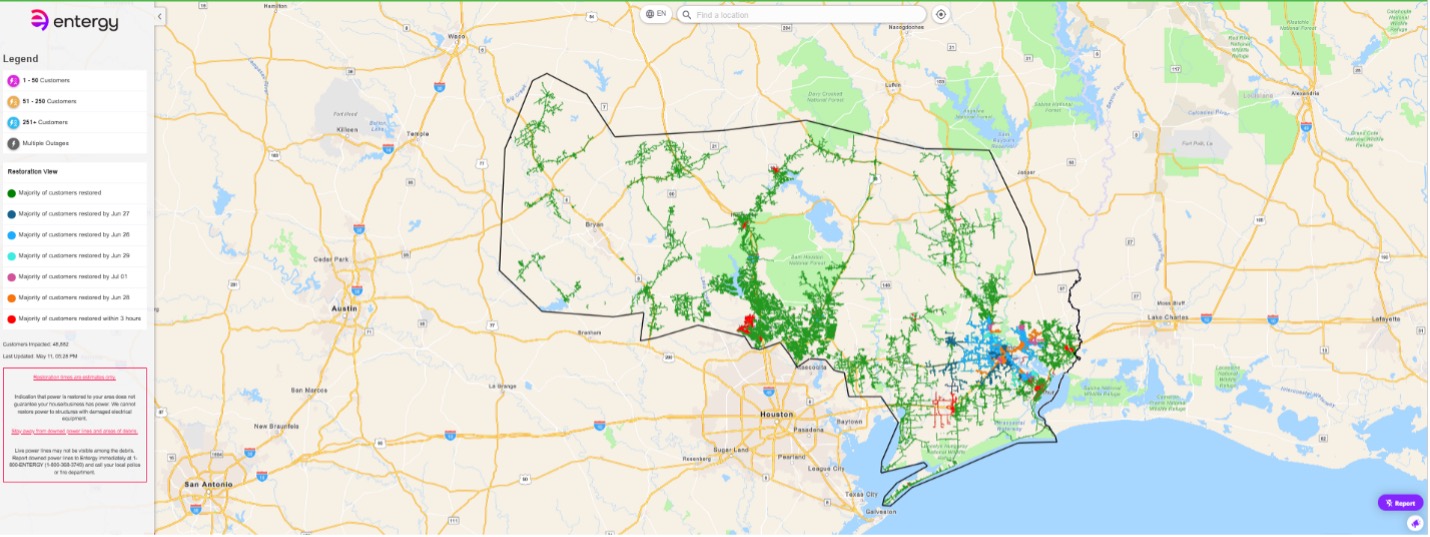 As assessments conclude and crews better understand the extent of damage, the map will shift to the estimated restoration time view.
Estimated times are shared at the feeder level — power lines that run through neighborhoods.
The map may look unchanged for several days after landfall. When timelines are available, color coded lines will appear to reflect estimated restoration progress.